The global Opportunity Mapping tool is the first to cross-map ecosystem distribution with human exposure to hazards at a global scale. It shows areas where ecosystem management could be used to protect the greatest number of people globally.
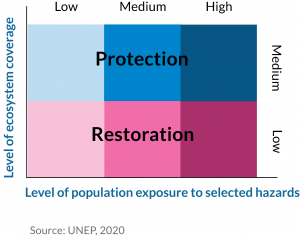
Specifically, the tool highlights geographic locations where ecosystem restoration or protection are particularly appropriate for reducing the impact of certain hazards. Areas where there is an overlap between population exposure to hazards and low ecosystem coverage because they have been depleted, degraded or damaged), are highlighted as areas with opportunities for restoration (to reduce disaster risk. In areas where ecosystem coverage and population exposure to certain hazards is high, ecosystem protection, (e.g. through the establishment of protected areas), can further reduce disaster risk, by ensuring that ecosystems stay healthy and protect people and assets.
The tool is based on global available datasets on hazard, population density and ecosystem coverage. The input layers sources are listed below. Data resampling was undertaken at a 10 x 10 km scale, so that the output layers have a spatial resolution of 100 km² cells of equal area. For each hazard, physical exposure was calculated by multiplying the hazard frequency with the population density, and then classified in terciles, from high to low.
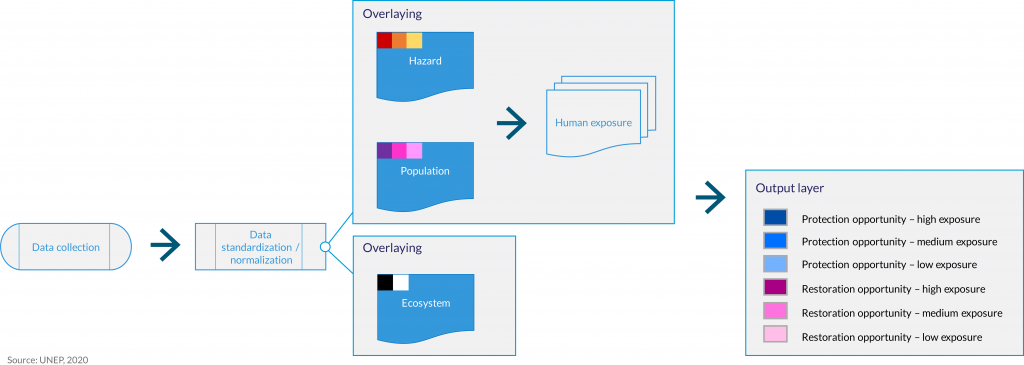
Then, an overlay operation determines the proportion of ecosystem coverage within each cell. Finally, a classification is applied for the output layers: restoration opportunities are identified for areas with low ecosystem coverage, and protection opportunities for areas with higher ecosystem coverage.
There are two noteworthy issues to take into consideration when using the tool. First, the percentage of urban cover is not estimated. This creates an artefact whereby built-up areas may be highlighted as areas with high ecosystem restoration potential even if this in not practically feasible nor realistic as land for restoration may not be available. Second, climatic zones (typically highly arid zones) were not included in assessing the suitability of ecosystem-based approaches as these are not areas where vegetation exist naturally and/ or cannot easily be detected at the 10 x10 km scale. Because of these limitations and its coarse spatial resolution, the global products should be used as an awareness and first screening tool for Nature-based approaches to disaster risk reduction and not for planning purposes, which require higher resolution data sets. However, the approach at the global scale is replicable and can be improved at the national or sub-national scales, provided higher resolution datasets on ecosystem coverage and/or hazard exposure are available. See our page on the National products.
Chatenoux, B., Peduzzi, P. (2007): Impacts from the 2004 Indian Ocean Tsunami: analyzing the potential protecting role of environmental features, Natural Hazards, 40:289–304, 2007. Available at: http://portal.nceas.ucsb.edu/working_group/valuation-of-coastal-habitats/relevant-papers/Chatenoux%20and%20Peduzzi,%202007.pdf/
Chatenoux, B. and Wolf, A. (2013) Ecosystem based approaches for climate change adaptation in Caribbean SIDS. UNEP/GRID‐Geneva and ZMT Leibniz Center for Tropical Marine Biology, pp.64. http://www.grid.unep.ch/products/3_Reports/EBA4CCA_CarribeanSIDS.pdf
Peduzzi, P. (2010): Landslides and vegetation cover in the 2005 North Pakistan earthquake: a GIS and statistical quantitative approach, Nat. Hazards Earth Syst. Sci., 10, 623-640, 2010. Available at: https://doi.org/10.5194/nhess-10-623-2010
UNEP (2010), Risk and Vulnerability Assessment Methodology Development Project (RiVAMP), Linking Ecosystems to Risk and Vulnerability Reduction The Case of Jamaica, United Nations Environment Programme, Geneva, pp.99, 2010.
http://postconflict.unep.ch/publications/RiVAMP.pdf
IUCN, Red List of Ecosystems: https://iucnrle.org/
World Resources Institute: Atlas of Forest Landscape Restoration Opportunities https://www.wri.org/applications/maps/flr-atlas/#